




The evening star caimagndlestick is one of the most powerful tools for spotting potential bearish reversals in financial markets. This three-candle pattern appears at the top of an uptrend, signaling that buying momentum is fading and sellers are beginning to take control.
Recognized across forex, crypto, and stock markets, the evening star candlestick not only alerts traders to possible trend changes but also provides a clear visual story of market psychology. In this comprehensive guide, you’ll learn how to identify the formation, interpret its components, and apply confirmation techniques to trade with confidence.
Whether you’re a beginner looking to understand candlestick signals or an experienced trader aiming to refine your reversal strategies, mastering the evening star candlestick can give you a decisive edge in capturing high-probability short opportunities.
What Is the Evening Star Candlestick Pattern?
The evening star candlestick is a three-candle bearish reversal pattern that appears at the top of an uptrend, signaling that buying momentum is fading and sellers are stepping in. It is one of the most widely recognized Candlestick Patterns in technical analysis and is used across forex, crypto, and stock markets.
What Does the Evening Star Candlestick Mean?
The evening star candlestick meaning reflects a shift in market sentiment from bullish to bearish. The pattern shows that buyers pushed price higher, then lost control to indecision, and finally sellers took over completely — a classic power transfer visible directly on the chart.
Why Is It Called the “Evening Star”?
The name comes from the planet Venus, which appears as a bright star in the evening sky — beautiful but marking the end of daylight. Similarly, this pattern marks the end of an uptrend. Just as Venus signals the coming darkness, the evening star candlestick formation signals the coming of bearish price action.
Evening Star as a Bearish Reversal Signal
The candlestick evening star pattern is classified as a bearish reversal signal. It does not indicate a continuation of the uptrend, it warns traders that the current rally may be over and that a downward move is likely to follow. This makes it valuable for traders looking to enter short positions or exit long ones.
Where Does the Evening Star Candlestick Appear on the Chart?
The evening star candlestick chart setup always appears after a sustained uptrend. You will typically find it near key resistance zones, overbought regions, or at major swing highs. Spotting it in the right location dramatically increases its effectiveness as a reversal signal.
Register with Trendo broker for professional trading based on the Evening Star candle.
Evening Star Candlestick Formation: Structure and Components
The Three Candles of the Evening Star Pattern
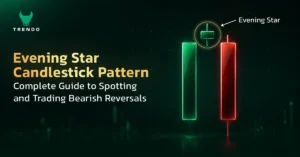
The evening star candlestick formation consists of exactly three consecutive candles. Each candle tells part of the story of how control shifts from bulls to bears. Understanding how to understand candlestick structure is essential before trading this pattern.
First Candle: The Bullish Candle
The first candle is a large bullish (green or white) candle that continues the existing uptrend. It shows strong buying pressure and gives no immediate warning of a reversal — bulls are fully in control at this stage.
Second Candle: The Star (Doji or Small Body)
The second candle is the “star” — a candle with a very small real body that gaps above the first candle’s close. It can be a doji candle, a spinning top, or any small-body candle. This candle signals indecision and a potential stall in the uptrend.
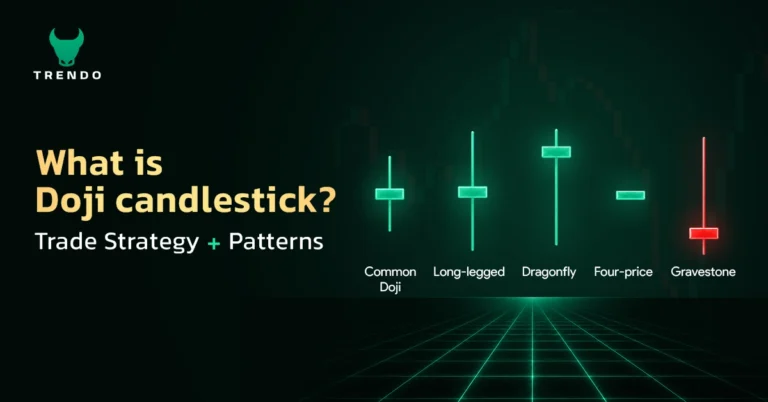
So, it is necessary to definetly know what is doji candlestick and what is the difference between doji and evening star.
Third Candle: The Bearish Confirmation Candle
The third candle is a large bearish (red or black) candle that closes deep into the body of the first candle. This is the confirmation that sellers have overwhelmed buyers. The deeper the third candle penetrates the first candle’s body, the stronger the reversal signal.
The Role of Gaps in Evening Star Candlestick Formation
Gaps between the first and second candle, and between the second and third candle, are ideal but not always present — especially in forex markets where prices move continuously. Even without gaps, the candlestick patterns evening star signal remains valid if the three-candle structure is clearly formed.
Color and Size Requirements for a Valid Evening Star
For a valid formation:
- The first candle must be large and bullish
- The second candle must have a small real body (color is less important)
- The third candle must be large and bearish, closing at least halfway into the first candle’s body
How to Identify the Evening Star Candlestick Pattern
Condition 1 — Prior Uptrend
There must be a clear uptrend before the pattern forms. An evening star appearing in a sideways or downtrending market holds little significance. The uptrend gives the reversal its context and power.
Condition 2 — Large Bullish First Candle
The first candle should be noticeably large, showing conviction from buyers. A weak or small first candle reduces the reliability of the entire pattern. Think of it as the final surge of bullish energy before exhaustion sets in.
Condition 3 — Gapping Star Candle in the Middle
The second candle should ideally open above the close of the first candle (gap up). Its small body indicates that neither buyers nor sellers dominated. This hesitation is the critical turning point in the candlestick evening star pattern.
Condition 4 — Bearish Third Candle Closing Into First Candle’s Body
The third candle must close well into the body of the first candle — ideally past the midpoint. Deeper penetration into the first candle’s body indicates a stronger bearish reversal signal.
Common Mistakes When Identifying the Evening Star Pattern
Traders frequently make these errors:
- Treating any three-candle sequence as an evening star without checking for a prior uptrend
- Accepting a third candle that barely clips the first candle’s body
- Ignoring the size of the second candle — a large middle candle disqualifies the pattern
- Trading the pattern in isolation without any external confirmation
Evening Star Candlestick vs. Morning Star Candlestick
Visual Similarities Between Evening Star and Morning Star
Both patterns share the same three-candle structure: a large candle, a small middle star, and a large candle in the opposite direction. To a new trader, they can look almost identical at first glance, especially when flipped on a chart.
Key Differences in Position and Signal
The position on the chart is what separates them entirely.
- The evening star forms at the top of an uptrend and is bearish.
- The morning star forms at the bottom of a downtrend and is bullish.
Context is everything in candlestick analysis.
Evening Star (Bearish) vs. Morning Star (Bullish)
The evening star warns of darkness ahead; the morning star promises the return of light. Both speak the same three-candle language — only the timing and direction change.
The bearish evening star candlestick pattern signals a sell opportunity, while the morning star signals a buy opportunity. Understanding both helps traders recognize reversals in either direction with equal confidence.
Quick Comparison Table: Evening Star vs. Morning Star
| Feature | Evening Star | Morning Star |
| Signal | Bearish Reversal | Bullish Reversal |
| Location | Top of Uptrend | Bottom of Downtrend |
| First Candle | Large Bullish | Large Bearish |
| Third Candle | Large Bearish | Large Bullish |
| Trade Action | Short / Sell | Long / Buy |
Evening Star Candlestick vs. Shooting Star
Why Traders Confuse These Two Patterns
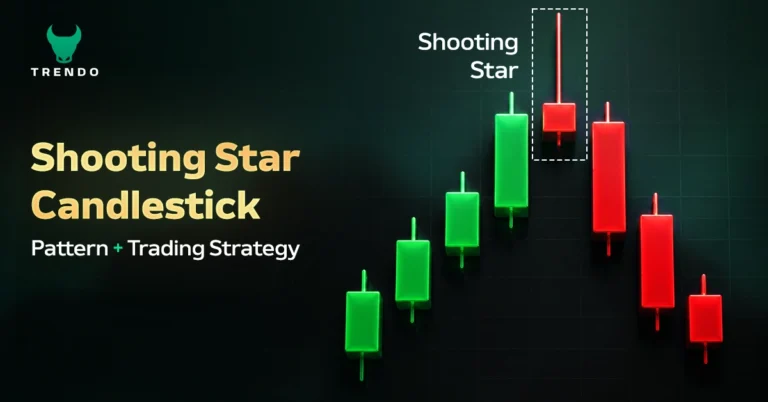
Both the evening star and the shooting star candlestick appear at market tops and signal bearish reversals. Traders new to candlestick analysis often mistake one for the other because of their similar position on the chart and their shared bearish implication.
Structural Differences
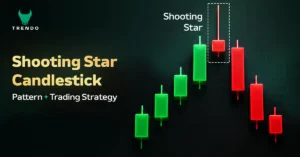
The shooting star is a single candle with a long upper shadow, small body, and little or no lower shadow. The evening star is a three-candle formation requiring a large bullish first candle and a confirming bearish third candle. They differ entirely in structure and required context.
Signal Strength: Which One Is More Reliable?
The evening star candlestick is generally considered more reliable than the shooting star because it requires three candles to confirm the reversal, providing more evidence before committing to a trade. The shooting star requires heavier external confirmation to be trusted as a standalone signal.
Quick Comparison Table: Evening Star vs. Shooting Star
| Feature | Evening Star | Shooting Star |
| Candles Required | 3 | 1 |
| Upper Shadow | Not required | Long upper shadow |
| Reliability | Higher | Moderate |
| Confirmation Needed | Less | More |
By registering with Trendo Broker, you can trade candlestick pattern-based strategies.
Finding an Evening Star is only half the job. The real edge comes from knowing whether the pattern is genuine—or just another false reversal.
Bearish Evening Star Candlestick Pattern: Signal Confirmation
Why Confirmation Matters for the Bearish Evening Star
Even a textbook bearish evening star candlestick pattern can fail. Markets are noisy, and false signals are common. Waiting for additional confirmation before entering a trade is the professional approach that separates disciplined traders from impulsive ones.
Confirming with the Next Candle
The simplest confirmation method is to wait for a fourth candle that continues lower after the pattern. A confirmation candlestick that closes bearish after the pattern increases conviction significantly. Some traders also look for an engulfing candle as added confirmation.
Confirming with Volume
Volume can serve as a reliable filter for the confirmation of a candlestick reversal pattern. Higher volume on the third (bearish) candle compared to the first (bullish) candle strengthens the signal.
Confirming with Resistance Levels
When the evening star forms directly at a well-established resistance level, the signal is far more powerful. Price rejected a key level AND formed a bearish reversal pattern — two independent signals pointing in the same direction simultaneously reinforce each other.
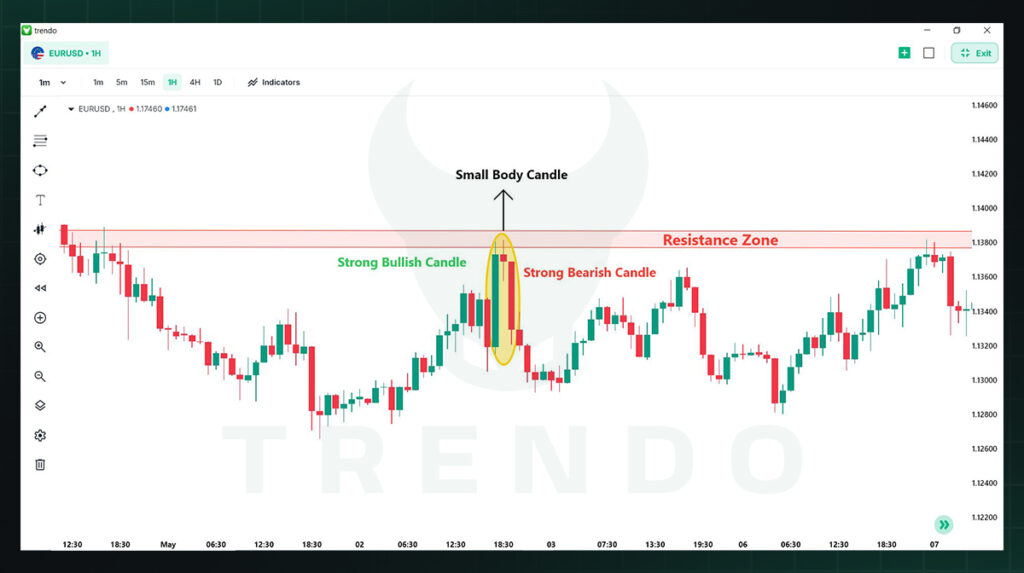
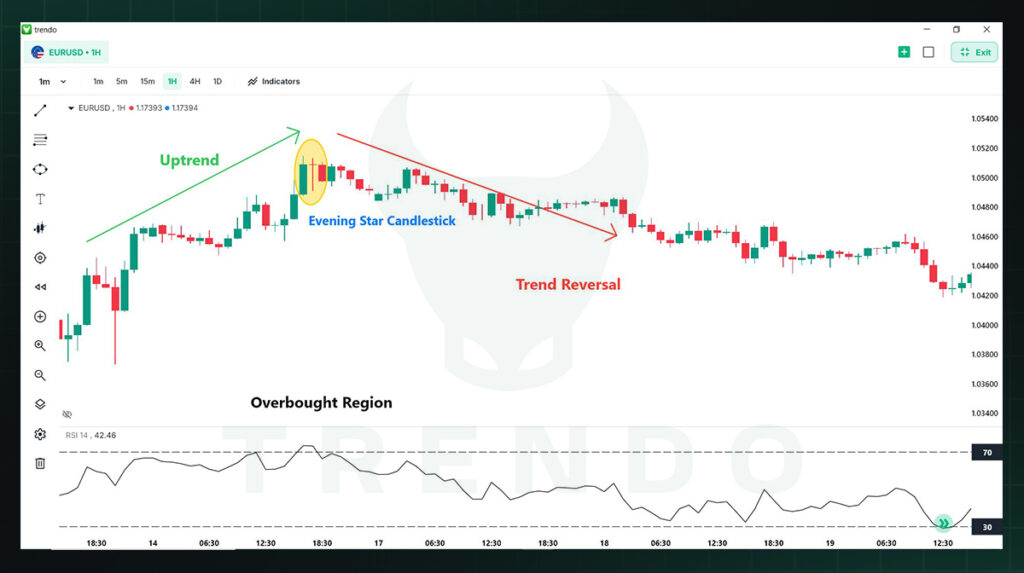
For example, the 1H EURUSD chart demonstrates a classic evening star candlestick pattern forming at a key resistance zone. The pattern consists of a strong bullish candle, followed by a small-bodied candle that signals market indecision, and concludes with a strong bearish candle that closes well into the body of the first candle. Moreover, the confirmation candle also appeared after the third candle closure.
This formation confirms a potential bearish reversal, illustrating how traders can use the evening star to anticipate downward price movements.
Confirming with RSI or Overbought Indicators
If the RSI reads above 70 when the evening star forms, it indicates the market is overbought, adding further weight to the bearish reversal case. Combining candlestick patterns with momentum oscillators meaningfully improves trade accuracy.
For instance, the following chart illustrates an evening star candlestick pattern forming at the top of an uptrend on the EUR/USD 1-hour timeframe. The pattern consists of a strong bullish candle, followed by a small-bodied candle showing market indecision, and a subsequent strong bearish candle that closes into the first candle’s body. The RSI confirms the setup, showing overbought conditions and weakening momentum, reinforcing the likelihood of a bearish reversal.
Can You Trade the Evening Star Without Confirmation?
Technically yes, but it carries a higher risk.
- Aggressive traders may enter at the open of the candle following the third candle.
- Conservative traders wait for one additional bearish close.
Your risk tolerance and the overall market context should guide this decision every time.
Evening Star Candlestick Trading Strategy
Core Rules for Trading the Evening Star Pattern
A structured approach to trading the evening star candlestick includes:
- Identify a clear prior uptrend on your chosen timeframe
- Spot the three-candle formation at resistance or a swing high
- Wait for confirmation (next candle close or overbought)
- Enter short at the open of the candle following confirmation
- Place a stop loss above the high of the second (star) candle
- Set a profit target at the next major support level
Entry Point for a Short Trade
The ideal entry is at the open of the candle after confirmation. Some traders enter at the close of the third candle when the signal is strong, and the broader context is clearly bearish. Entering before the third candle closes risks trading an incomplete, unconfirmed pattern.
Setting the Stop Loss
Place your stop loss just above the high of the star candle (second candle). This level represents the zone where the reversal scenario is invalidated. If price pushes back above it, the pattern has failed, and the original uptrend may be resuming with new force.
Real Example of Trading with Evening star candlestick
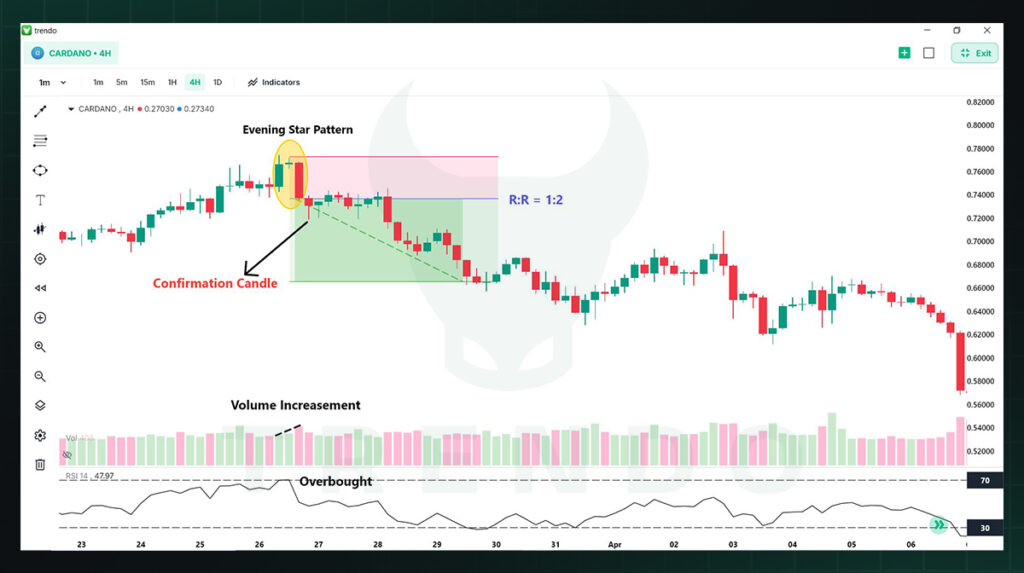
This chart demonstrates a high-probability evening star candlestick pattern on the Cardano 4-hour timeframe. The pattern appears after an uptrend with a strong bullish candle, followed by a small-bodied indecision candle, and a bearish confirmation candle that closes below the previous candle’s body.
The RSI indicates overbought conditions, and volume increases during the reversal, reinforcing the signal. This combination of price action, volume, and technical indicators highlights an ideal sell position for traders.
Best Timeframes for Trading the Evening Star Candlestick
The evening star candlestick works best on these timeframes:
- H4 and Daily — Most reliable for swing traders seeking high-quality setups
- H1 — Suitable for intraday traders with strong confirmation filters in place
- Weekly — Excellent for position traders seeking major macro reversals
Combining the Evening Star Candlestick with Technical Tools
Evening Star + Resistance Levels
When the evening star candlestick chart forms right at a horizontal resistance or a Fibonacci retracement level (such as 61.8%), the probability of a successful reversal is significantly higher. Price memory at these levels reinforces the bearish reversal case independently.
Evening Star + Moving Averages
An evening star forming below a key moving average (such as the 200 EMA on the daily chart) or at a declining moving average acts as a powerful sell signal. The moving average serves as dynamic resistance, aligning with the pattern’s directional message perfectly.
Evening Star + RSI (Relative Strength Index)
RSI divergence — where price makes a higher high but RSI makes a lower high — combined with an evening star candlestick pattern is among the strongest bearish setups in technical analysis. Both tools agree: the uptrend is losing energy and a reversal is likely imminent.
Evening Star Candlestick in Different Markets
Evening Star Candlestick in Forex Trading
In forex, the evening star candlestick is highly effective on major pairs like EUR/USD, GBP/USD, and USD/JPY. Since forex trades 24 hours, true gaps are rare, but the three-candle logic applies equally. Daily and H4 charts consistently produce the most reliable evening star setups.
Evening Star Candlestick in Crypto Markets
Crypto markets are highly volatile, which means evening star patterns can form and resolve quickly. The pattern works best on BTC/USD and ETH/USD on H4 or daily charts. Confirmation is especially important in crypto due to the rapid speed at which prices can move.
Evening Star Candlestick in Stock Markets
In equities, the evening star candlestick often appears at earnings highs or after strong rally phases in individual stocks or indices. Because stock markets have defined open and close times, true gaps between candles are common, making the pattern closer to its textbook definition.
Best Market Conditions for the Evening Star Signal
The pattern performs best when:
- The market is trending strongly before the pattern forms
- Volume increases noticeably on the third bearish candle
- The pattern appears at a recognized resistance level or key Fibonacci zone
- Broader market sentiment is shifting negative
Accuracy and Reliability of the Evening Star Candlestick Pattern
Factors That Increase Signal Reliability
- Pattern forms at major resistance or Fibonacci retracement levels
- Third candle closes deep (more than 50%) into the first candle’s body
- High volume on the third bearish candle compared to the first
- RSI is in overbought territory (above 70) when the pattern appears
- Pattern forms on a higher timeframe (H4, Daily, or Weekly)
When Does the Evening Star Pattern Fail?
The pattern fails most often in strongly trending bull markets where buyers absorb every sell signal without hesitation. It also underperforms in low-volume environments where there is insufficient participation to sustain a reversal. The pattern has a lower success rate in choppy or ranging market conditions.
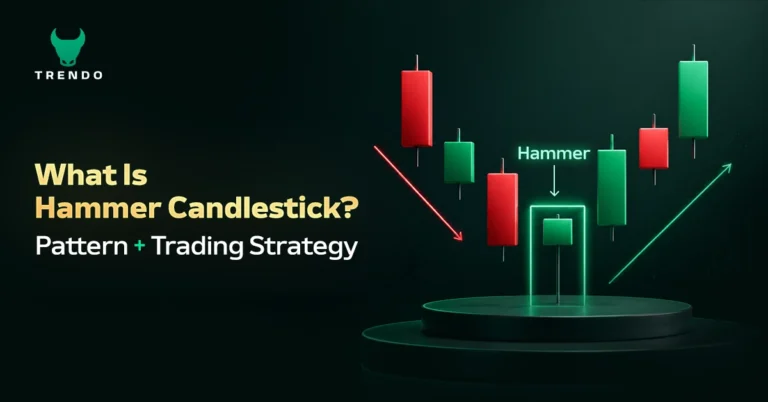
Patterns that resemble the hammer candlestick pattern or the inverted hammer candlestick are sometimes confused with the star candle at the pattern’s center — always evaluate the complete three-candle context before concluding.
How to Improve Your Evening Star Trade Accuracy
- Never trade the pattern without first confirming the prior uptrend
- Always use at least one additional confirmation signal before entry
- Combine the pattern with support/resistance levels for full context
- Backtest on your preferred market and timeframe before trading live
- Keep a trading journal and track which exact setups perform best
Conclusion: Mastering the Evening Star Candlestick Pattern
The evening star candlestick is one of the most powerful bearish reversal signals in technical analysis. Its three-candle structure — a bullish candle, an indecisive star, and a bearish confirmation — tells a clear story of a trend losing momentum and reversing direction.
Whether you trade forex, crypto, or stocks, recognizing the candlestick evening star pattern at the right location and combining it with proper confirmation gives you a meaningful, data-backed edge in identifying high-probability short trade setups.
The evening star warns of darkness ahead; the morning star promises the return of light. Both speak the same three-candle language — only the timing and direction change.
Mastery comes from consistent practice: study historical charts, find the pattern at resistance levels, and always combine it with volume or momentum indicators. Over time, the evening star candlestick will become one of the most reliable and recognizable tools in your entire trading toolkit.
Download and install Trendo trading platform now and start trading in global markets using a 20% initial deposit bonus.